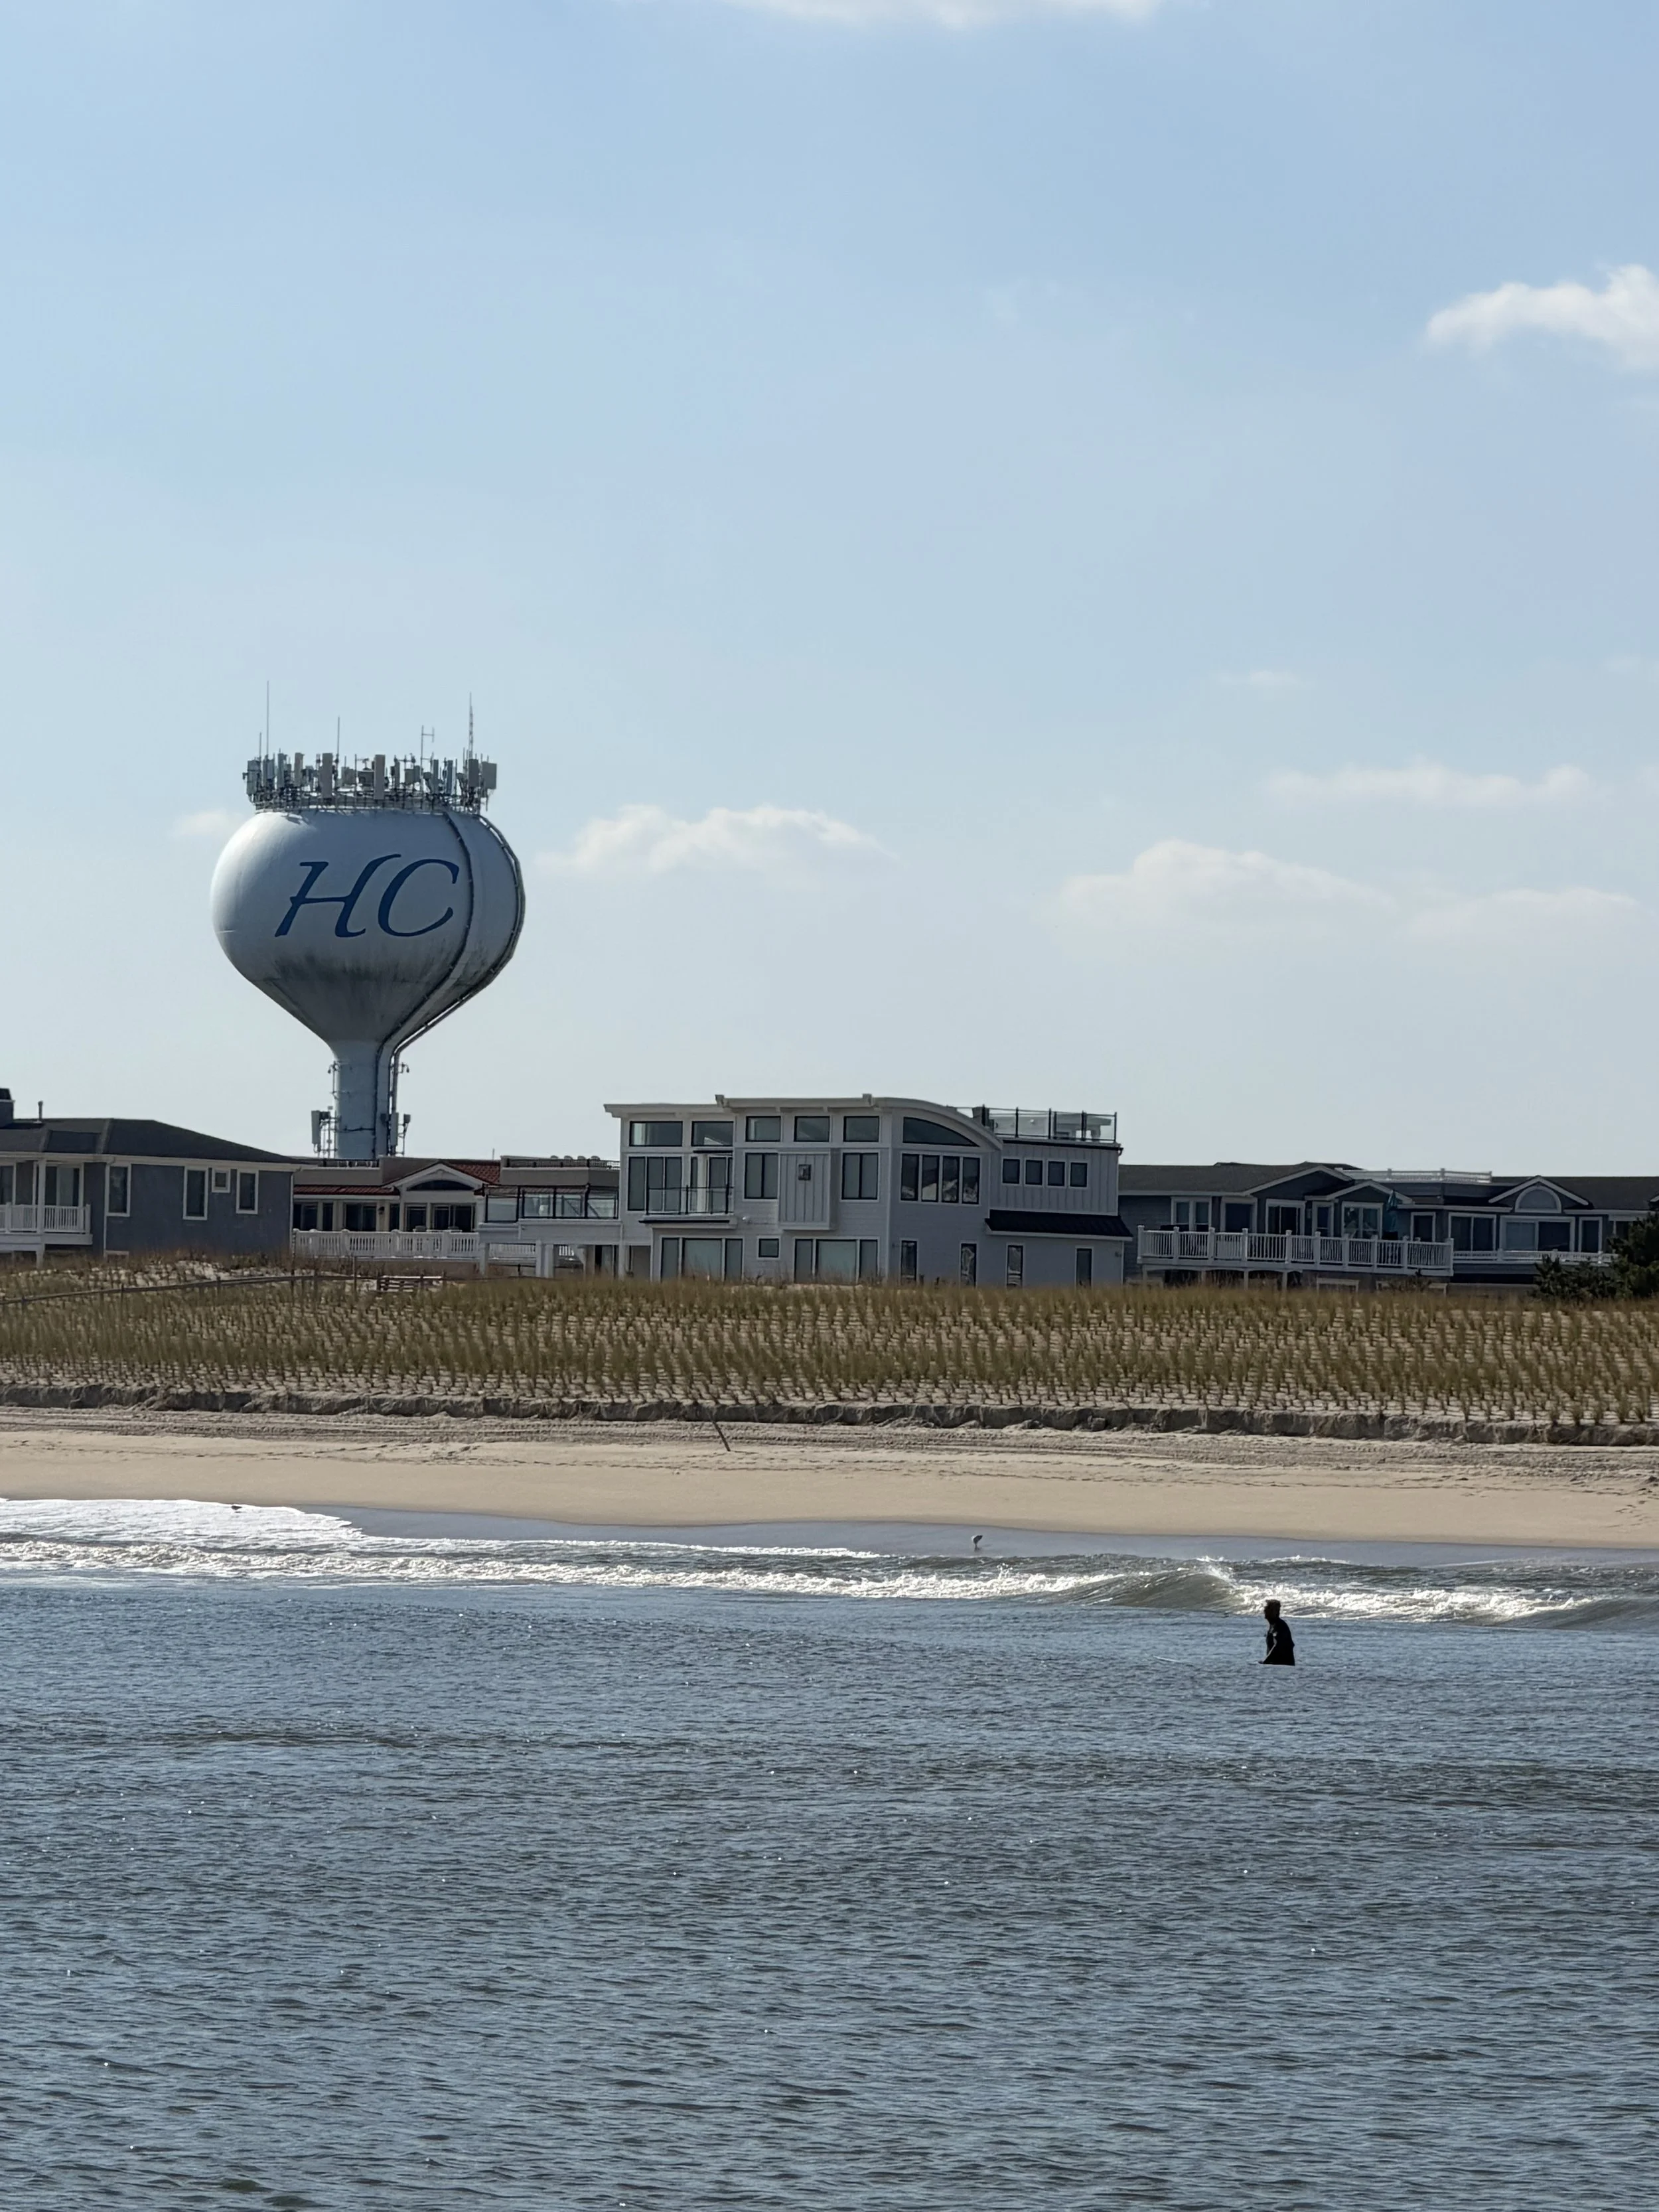
As we move further into fall on Long Beach Island, October brought some interesting changes to the local real estate market. Sales increased considerably compared to September, while pricing remained strong and inventory continued to grow slightly.
However, the month was not without its challenges. A significant nor'easter brought coastal flooding to portions of the island, particularly along the bayside, and we noticed a slowdown in market activity following the storm. This isn't necessarily unusual for LBI, where major coastal weather events can temporarily shift attention away from buying and selling.
With the holiday season also approaching, we're entering a time of year when real estate activity traditionally begins to quiet down relative to the rush we see over summer and early fall.
Here's how October 2026 compared to September 2026:
Total Sales
September 2026: 34 properties sold
October 2026: 55 properties sold
Sales increased significantly in October, with 55 properties closing compared to 34 in September. That's an increase of nearly 62 percent, making October one of the more active months we've seen this year in terms of completed transactions.
This is particularly interesting considering the slowdown in activity we experienced following the nor'easter. It's important to remember that closings generally reflect contracts negotiated several weeks, or sometimes months, earlier. Therefore, October's strong sales numbers don't necessarily reflect the level of buyer activity occurring during the latter part of the month.
Nevertheless, the increase demonstrates that a substantial number of transactions were successfully moving through the market as we headed deeper into fall.
Average and Median Sale Price
September 2026 Average Sale Price: $3,062,274
October 2026 Average Sale Price: $2,415,424
September 2026 Median Sale Price: Approximately $2,000,000
October 2026 Median Sale Price: $2,299,999
2026 Year-to-Date Average Sale Price: $2,464,868
2026 Year-to-Date Median Sale Price: $2,050,000
The average sale price decreased by approximately 21 percent in October, while the median sale price increased by roughly 15 percent.
At first glance, these numbers may seem contradictory, but they show why looking at both statistics is so important, especially in a market like Long Beach Island.
September's exceptionally high average sale price was likely influenced by several higher-end transactions that pulled the overall average upward. October's lower average, combined with a higher median, suggests a different mix of properties closing during the month.
Looking at the year as a whole provides some additional perspective. Through the first ten months of 2026, the average sale price on LBI stands at approximately $2.46 million, while the median is $2.05 million. These figures help put the monthly fluctuations into context and provide a more clear picture of where the market has been trading throughout the year.
As always, monthly pricing statistics on LBI can fluctuate significantly depending on the types of properties that happen to sell. These changes should not be interpreted as property values increasing or decreasing by those same percentages across the island.
New Listings
September 2026: 55 new listings
October 2026: 49 new listings
New listing activity declined slightly in October, with 49 properties coming onto the market compared to 55 in September.
This is not particularly surprising as we move further into the fall season. Many homeowners who planned to sell after enjoying the summer have already brought their properties to market, while others may prefer to wait until after the holidays or closer to the spring selling season.
The nor'easter may have also caused some prospective sellers to delay their plans while assessing their properties or addressing storm-related concerns.
Despite the slight decline, 49 new listings still represents a welcomed amount of new inventory entering the market during October.
Sales to List Price Ratio
September 2026: 98.6%
October 2026: 97.3%
The sale-to-list price ratio declined slightly in October, falling from 98.6 percent to 97.3 percent.
While this indicates that buyers negotiated somewhat further below asking price compared to September, properties were still selling at an average of more than 97 percent of their asking prices.
September's exceptionally strong ratio, combined with its short median days on market, suggested that many of the properties closing that month had attracted considerable buyer interest.
October's numbers indicate a slight return toward more typical negotiating conditions, although sellers continued achieving prices relatively close to their asking prices.
As always, accurate pricing remains one of the most important factors in determining how quickly a property sells and how close the final sale price comes to the original asking price.
Median Cumulative Days on Market (CDOM)
September 2026: 19 days
October 2026: 40 days
Median cumulative days on market increased from 19 days in September to 40 days in October.
While this is a noticeable increase, it's important to put it into perspective. September's median of just 19 days was particularly low, indicating that many of the properties closing during that month had attracted buyers in the first week. Buyers who have been waiting or were ready to buy, did just that in September and made their decisions quickly.
October's increase suggests that a greater portion of the properties closing had spent additional time on the market before going under contract. With as many homes selling in September and continued buyer interest in the market, October buyers absorbed the portion of the market sitting slightly longer.
It's also important to remember that cumulative days on market measures the time a property was listed before going under contract, not the time it took to reach closing.
Total Inventory
September 2026: Approximately 134 active properties
October 2026: Approximately 141 active properties
Inventory increased slightly in October, rising from approximately 134 active listings in September to 141.
While this represents a modest increase, the number of homes available for sale remains relatively limited compared to historical levels on Long Beach Island.
It's also worth mentioning that the status of properties is only as accurate and up to date as the information maintained by the listing agent. Some properties appearing as active may already be under contract, meaning the number of homes actually available to buyers could be lower.
Market Insights
October's statistics tell an interesting story about the Long Beach Island real estate market.
On paper, it was a particularly strong month for sales, with 55 properties closing and the median sale price increasing to approximately $2.3 million. At the same time, properties generally spent longer on the market, buyers negotiated slightly further below asking price, and inventory increased modestly.
However, statistics only tell part of the story.
Following the significant nor'easter that brought flooding to portions of the island, particularly along the bayside, we experienced a noticeable slowdown in market activity.
This is something I've seen happen following major storms on LBI. Buyers and sellers understandably shift their attention toward the immediate impacts of the weather, property conditions, cleanup, and other concerns. For some prospective buyers, a major coastal storm can also serve as a reminder of the realities that come with owning property on a barrier island.
Historically, these periods of uncertainty have not necessarily translated into lasting changes in the local real estate market, although the longer-term impact of any particular storm takes time to evaluate. Luckily, this storm was not nearly as catastrophic as superstorm Sandy.
We're also approaching the holiday season, which traditionally brings a quieter period for real estate activity. Between Thanksgiving, Christmas, and the colder winter months, some buyers and sellers simply put their plans on hold until the new year.
That said, Long Beach Island continues to demonstrate remarkable resilience. Its limited land supply, established second-home market, and strong lifestyle appeal have historically helped distinguish it from many other real estate markets around the country.
While LBI is certainly not immune to broader economic conditions, national real estate headlines don't always accurately reflect what's happening here locally.
What This Means for Buyers and Sellers
For sellers, October's numbers remain encouraging. Sales and pricing continue to show strength, but with inventory slowly increasing and the quieter winter months approaching, pricing and presentation will be especially important for a seller's dream of a quick sale. Well-priced homes in desirable locations should continue to attract serious interest.
For buyers, the transition into late fall and winter can create some great opportunities. As more casual buyers step away from the market, those who remain serious about purchasing may face less competition and find themselves in a better position to negotiate, particularly on properties that have been listed for an extended period.
Source: Bright MLS® Statistics for Residential, Multi-family, and Land Sales Data.