

November vs. December 2025 + Year-End Review of 2025 vs. 2024
November 2025 vs. December 2025
Total Sales
November: 26 homes sold
December: 29 homes sold
Sales rose slightly into the end of the year, a modest but encouraging increase considering the holidays typically mark a slowdown. Who wouldn’t want a beach house as their Christmas/Hanukkah gift?
New Listings
November: 29 new homes listed
December: 24 new homes listed
New inventory dropped again in December, continuing a seasonal trend and pushing inventory levels even lower as we ended the year.
Average & Median Sales Price
Average Sale Price:
November: $2,219,000
December: $1,626,759
Median Sale Price:
November: $2,287,000
December: $1,550,000
Both the average and median sale prices saw a significant decline in December compared to November. This drop is likely due to a shift in the mix of homes that closed during the month. December often sees fewer high-end closings as many luxury buyers and sellers aim to wrap up deals before the holidays or push them into the new year for tax or timing purposes. At the same time, many of the homes closing in December may have gone under contract during the slower fall months, when buyer urgency and pricing leverage tend to soften. As a result, the properties that closed in December may have skewed more toward mid-range or entry-level homes, pulling down the overall pricing metrics even if market conditions remain stable.
Sales to List Price Ratio
November: 97.4%
December: 97.9%
Despite lighter volume and lower prices, buyers were still paying close to asking. This uptick in ratio shows that well-priced homes are still drawing strong interest with little room for negotiation.
Cumulative Days on Market (CDOM)
November: 36 days (median)
December: 26 days (median)
Homes sold even faster in December, suggesting that motivated buyers are still active, particularly when inventory is scarce and quality homes appear.
Active Inventory
November: ~104 total properties (residential, multifamily, land)
December: ~80 total properties
Of those, only about 68 are single-family homes
Inventory has dropped to some of the lowest levels we’ve seen, continuing to limit options for buyers heading into 2026.
2025 vs. 2024 Year-End Comparison
I broke the data into two categories: fee simple homes (the meat of the LBI market), and all property types (including condos, multifamily, and land).
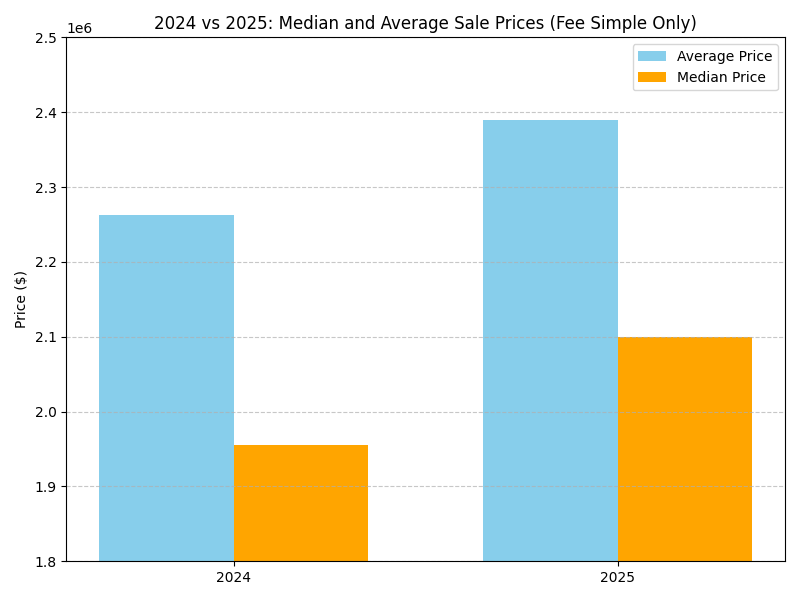
Fee Simple Properties
Median Sale Price:
2024: $1,955,000
2025: $2,100,000
↑ 7.4% increase
Average Sale Price:
2024: $2.262M
2025: $2.39M
↑ 5.7% increase
Total Sales:
2024: 354 homes
2025: 319 homes
↓ 9.9% decrease
New Listings:
2024: 550 homes
2025: 458 homes
↓ 16.7% decrease
Median Days on Market:
2024: 52 days
2025: 42 days
↓ 19.2% faster sales
All Property Types (Including Condos, Multifamily, and Land)
Median Sale Price:
2024: $1.8M
2025: $1.8M
No change
Average Sale Price:
2024: $2.096M
2025: $2.155M
↑ 2.8% increase
Total Sales:
2024: 403
2025: 402
Nearly identical
New Listings:
2024: 626
2025: 570
↓ 8.9% decrease
Median Days on Market:
2024: 52 days
2025: 41 days
↓ 21% improvement

The fee simple breakdown offers a clearer view of true market conditions, as most properties on Long Beach Island fall into this category. By isolating fee simple sales, we can filter out condos, co-ops, and other property types that may introduce statistical noise or skew trends. This approach helps paint a more accurate picture of buyer behavior and pricing within the island's core residential market.
What This Means for Buyers and Sellers
Across the country, headlines are surfacing about softening prices and rising inventory, but Long Beach Island continues to chart its own path. This is a supply-constrained, high-demand market, with no more land being created and a limited inventory pipeline. LBI is a want market, and it remains extremely sheltered from national real estate trends.
For sellers, inventory remains incredibly tight. As long as your home is priced correctly and in a good location, it will attract serious attention, often with more than one offer on the table. Homes that show well and are move-in ready continue to sell quickly.
For buyers, the market still favors decisiveness. Well-priced homes continue to go under contract quickly, and some still sell over asking. With mortgage rates easing slightly and talk of rate cuts in 2026, competition could intensify. If the laws of supply and demand continue to hold, as they almost always do, we could see another round of price acceleration.
Source: Bright MLS® — Residential, Multifamily, and Land Sales Data